Profiling Data at Table Level
You can assess your data quality by profiling the data at table level. You need to schedule a data profiling job and provide the data quality score by assessing the data quality.
Data Quality tab is not available if the Enable DQ Sync option is enabled for environments.
To profile data at table level, follow these steps:
- Go to Application Menu > Data Catalog > Metadata Manager > Explore.
- On the Explore tab, click an environment tile to see its details.
- In the Data Catalog pane, click a table.
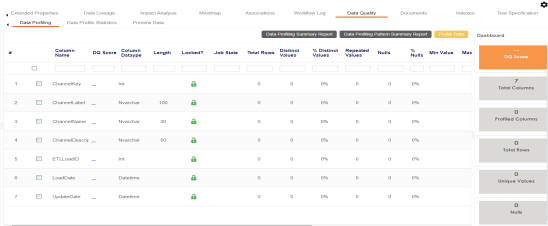
- Click the Data Quality tab.
- Select columns.
- Click Profile Data.
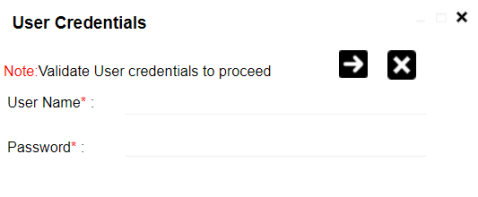
- Enter credentials to connect with the database.
- Enter appropriate values in the fields. Fields marked with a red asterisk are mandatory. Refer to the following table for field descriptions.
- Local: Refers to your local machine.
- Server: Refers to the machine where your application is deployed.
- Total Values: Select the check box to display the total number of rows in the selected columns.
- Distinct Values: Select the check box to display the number of distinct values in the selected columns.
- Repeated Values: Select the check box to display the number of repeated values in the selected columns.
- Null Values: Select the check box to display the number of null values in the selected columns.
- Minimum Value: Select the check box to display the minimum value in the selected columns. You can enable or disable analysis of minimum value for character data. For more information on this, refer to the Configuring Data Profiling and DQ Scores topic.
- Maximum Value: Select the check box to display the maximum value in the selected columns. For more information on this, refer to the Configuring Data Profiling and DQ Scores topic.
- Most Frequent Value: Select the check box to display the most frequent values in the selected columns.
- Least Frequent Value: Select the check box to display the least frequent values in the selected columns.
- Most Frequent Patterns: Select the check box to display the most frequent patterns in the selected columns. For more information on this, refer to the Configuring Data Profiling and DQ Scores topic.
- Least Frequent Patterns: Select the check box to display the least frequent patterns in the selected columns. For more information on this, refer to the Configuring Data Profiling and DQ Scores topic.
- Click Schedule.
- Use the following options:
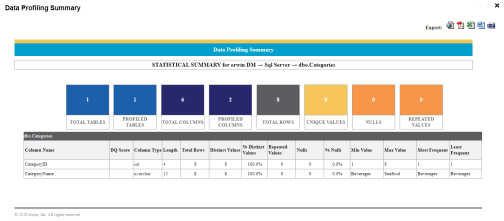
- Data Profiling Summary Report
- To view data profiling summary, click Data Profiling Summary Report.
Data Profiling Summary page appears.
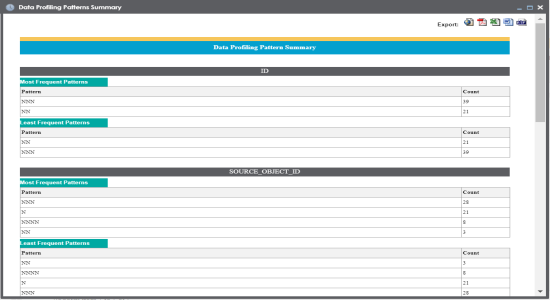
- Data Profiling Pattern Summary
- To view data profiling pattern summary report, click Data Profiling Pattern Summary Report.
- The Data Profiling Pattern Summary page appears.
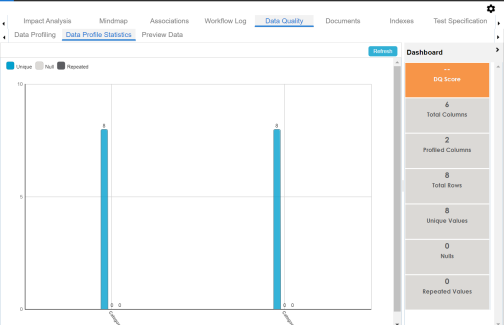
- Data Profile Statistics
- To view data profile statistics, click Data Profile Statistics.
- The data profile statistics appears in a bar graph.
- Click DQ Score.
- The Update DQ Score page appears.
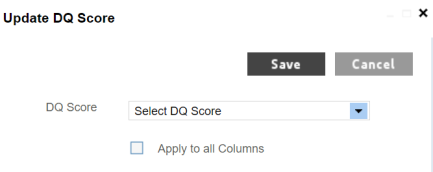
- Select DQ Score and click Save. The DQ Score is updated.
By default, the Data Profiling tab opens.
The User Credentials page appears. For more information on enforcement of user credentials, refer to the Enforcing Credentials for Data Access or Preview topic.
The Job Scheduler page appears.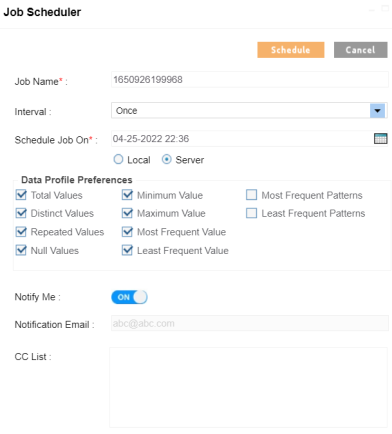
|
Option |
Description |
|---|---|
|
Job Name |
Specifies the job name. For example, Administrator1585030550001. This field autopopulates with a job name. You can edit it and enter a different job name. |
|
Interval |
Specifies the frequency of the job. For example, Every Week. |
|
Scheduled Job On |
Set the date and time of the job using For example, 03-24-2020 11:45. |
|
Local or Server |
Select whether the job uses local or server time. |
|
Data Profile Preferences |
Select the corresponding check boxes to give your data profile preferences in the profile grid report. |
|
Notify Me |
Switch Notify Me to ON to receive email notification. For more information on email notification, refer to the Configuring Notification on Profiling Data topic. |
|
Notification Email |
This field is autopopulated with your email ID. If you enable notifications in the Metadata Manager Settings, you can receive email notifications from the administrator's email ID about the scheduled job. |
|
CC list |
Enter a comma-separated list of email IDs that should receive email notifications about the scheduled job. For example, ab.dav@xyz.com, cal.kai@xyz.com |
The data profiling job is scheduled.
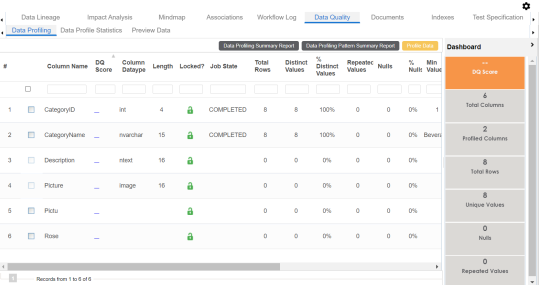
The data profiling job is completed at the scheduled time and the job state changes to COMPLETED.
|
Copyright © 2026 Quest Software Inc. |